Although I love to use R for customization and visualisation, certain graphs are much more easy and intuitive in Tableau because most of its interactions are achieved simply by dragging and dropping items onto the canvas.
I recently ordered two books, which I am using to learn Tableau. Visual Analytics with Tableau by Alexander Loth and Practical Tableau by Ryan Sleeper.
I completed the first 6 chapters of Alexander’s book and reproduced his graphics on my Tableau. In chapter 1, I familiarized myself with the Tableau interface. In chapter 2, I learnt about data visualizations in Tableau. Apparently, every measure on a view in Tableau is somewhat aggregated. In chapter 4, I learnt how to change the aggregation type and create self-calculated fields as well as come up with new parameters. In chapter 5, I learnt about variety of calculations (quick table calculations and customized table calculations) for in-depth analyses.
Finally, in chapter 6 I learnt to create maps. Creating a map is quite easy and intuitive in Tableau. I wish social scientists would use visualization software like Tableau to create some of their graphs. But this is unlikely to happen because the importance of using codes in data analysis is so that one’s analysis can be reproduced. In other words, somebody else can easily see how one got to the answer. But this cannot be done with a drag-and-drop system like Tableau. Besides, one can use R without having to pay a dime!
Anyway, I collected data from Freedom House, an NGO that conducts research and advocacy on democracy. I uploaded the data into Tableau, filtered it in Tableau and created the map below:
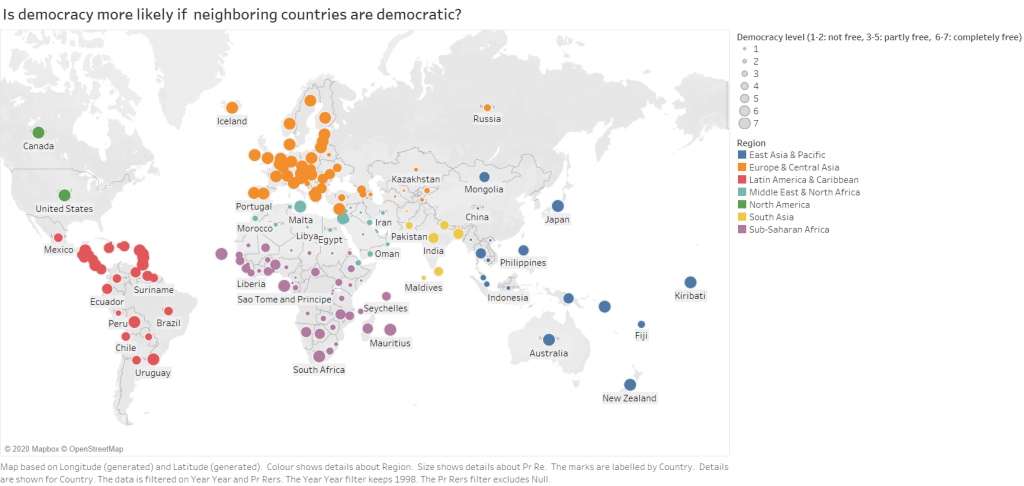
This is not a good visualisation because it is difficult to differentiate between the sizes of democracy level. But this is not the point. The point here is: it was quite easy to create this map. I just filtered the data to include only the year 1998. I completed the visualisation by simply draging the dimensions and measures into the marks.
The book by Ryan Sleeper encompasses even more information than Alexander’s book. I have just started to work through the book.
