I have completed part I (chapter 1-17) and part II (chapter 18 – 46) of Practical Tableau by Ryan Sleeper. I think Alexander’s book and Ryan’s book complement each other. Alexander succeeded in focusing on the fundamentals of Tableau and kept the page count modest. It definitely gave me a good start with Tableau.
Ryan, on the other hand, said that his book is best for those who have some basic “101-level” knowledge, but do not have the pre-requisites for technical “601-level” skills. More specifically, the book aims to help one build on the basic knowledge and take one’s applied knowledge of Tableau to an upper level.
Nevertheless, Part I covers the key concepts that every Tableau user should know. With the chapters in that section make, a brand-new Tableau user can learn how to use Tableau with only this book. I skimmed through the introductory sections of Part I because they comprise things I already learnt in Alexander’s book. But they offered me the opportunity to review basic concepts and ensure that I have the prerequisites required for subsequent chapters. By the end of Part I, I had the prerequisites to apply the “201-level” material. At this point, I was able to reproduce the interactive dashboard below.
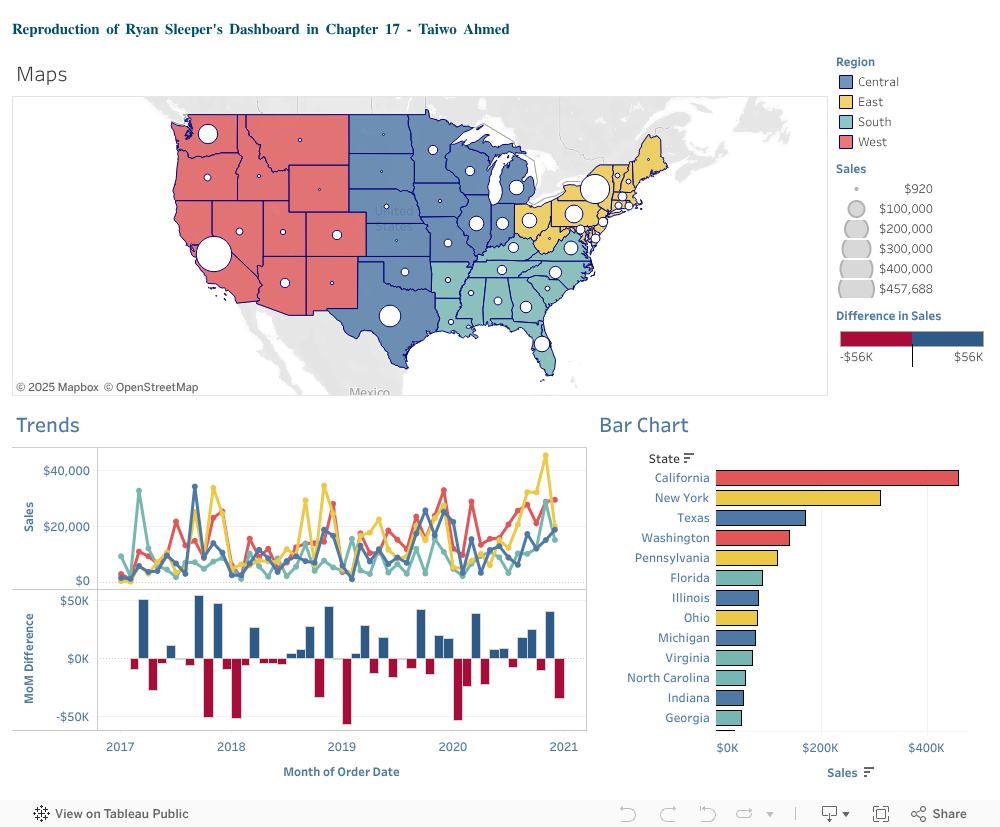
Unfortunately, I could not maintain interactivity while embedding my dashboard into WordPress. I read that WordPress.com sites on the Free, Personal, and Premium plans limit the inclusion of some types of Code tags. The standard Tableau “Embed Code” includes such blocked code tags (e.g. <object>, <script>). Thus, one might need to upgrade to a Business plan to embed a dashboard into a WordPress blog. In any case, you can click on this link to see the interactivity of my dashboard. The trend lines and bar chart update when a region is clicked on the map.
What I found negative about Ryan’s book is that, sometimes, he omits the description of a few details, which makes it difficult to reproduce everything from scratch (e.g. changing of axis intervals, changing number formats, changing the name and colour of label, changing the colour border of charts). A few times, I had to solve such problems through trial and error. But most of the times, I just knew what to click to get what I wanted. Things sort of became intuitive after completing part I.
Part II consists of step-by-step tutorials on how to create a variety of charts in Tableau. More importantly, each tutorial explains how each chart type is used. Regarding analysis, this explanation helps in choosing the right graph for the task at hand. I indeed acquired advanced knowledge of Tableau because many of the chart types explained can hardly be done using the “out-of-the-box” in the Tableau’s “Show Me” platform.
The charts are particularly useful for data or statistical analysis in a business context to help businesses make better decisions, or solve business challenges and achieve operational excellence. Some of such charts include:
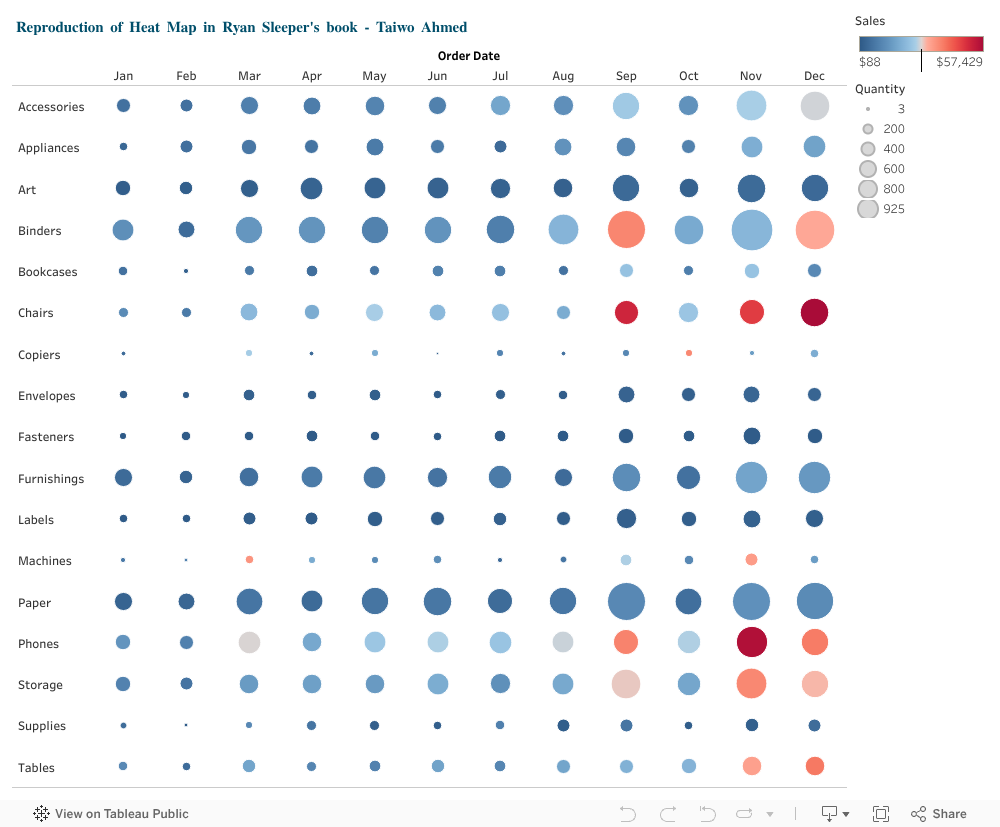
In a heatmap, the values of an indicator are described in circles with different sizes. Higher values have bigger circles with intense colors. That’s why they are called heatmap. In the visualisation above, large blue circles mean that although a sub-category sold a relatively large quantity, it relatively brought in low revenue. But small red circles means the quantity sold in the sub-category is relatively small; yet a relatively high revenue is generated.

The dashboard shows different graphs. The graph on top is a dual-axis combination charts, or Combo Charts. They are an effective chart type for showing related information in a single chart by combining views. The dual axis combo chart, above, shows Sales and Discount by Year and Product Category.
Pareto chart is also a dual-axis combination chart that highlights dimensions that have the most influential impact to the measure at hand. While this chart type are used for different purposes, it is among the seven basic tools of quality control, and has been known to be useful for identifying the largest contributors to a cumulative total.
Bullet graphs improve on the bar chart in that it provides additional points of comparison. As Ryan Sleeper explains, using bullet graphs is only appropriate if you have a point of comparison, such as the performance for last year or yearly performance goals. Here, the point of comparison here is previous year’s performance. But an alternative application of bullet graphs, Sleeper further explains, is to use them in showing progress toward goals.

Control charts, or Shewhart charts, were designed to evaluate whether production is
in line with statistical control. Like pareto charts, histograms, and scatter plots,
they are part of the seven basic tools for quality control. Ryan Sleeper used basic control charts to show a time-series analysis with reference lines. These lines describe the mean performance along with an upper control and lower control limit.
The basic control chart above is a visualization of the Profit Ratio measure in the Sample -Superstore dataset. It shows both the average profit ratio during the weeks and the profit ratio of the business is likely to fall between −19% and 42%. Some weeks lie outside the lower control limit and should therefore be looked into.
Although Ryan demonstrates the usefulness of Tableau with business-oriented examples, Tableau can be useful in visualizing phenomenon in other areas of social science. For example, I came across an impressive visualization on conflicts by Soham Wadekar (see image below). I aspire to being able to create this kind of visualisation.